
CAS DataLoggers Helps Design, Manufacture & Program Test Setup
 In 2009 CAS DataLoggers helped design, assemble and program the data acquisition and control solution for an Ohio manufacturer who needed a test bench setup for their directional control valves. In this application, hydraulic fluid flowing through a military aircraft was causing destructive pressure spikes when a remotely actuated hydraulic valve rapidly opened and closed, loosening the fittings in the hydraulic lines. Pressure spikes, similar to water hammers, are caused when the flow rate of moving fluid is suddenly changed. This generated pressures measuring into the thousands of PSI’s, producing substantial force and causing a major inconvenience for flight crews which had to spend hours retightening the fittings caused by these spikes. In response, the customer developed a new valve specification which stated that the actuating period had to be slower than a specified value to limit this. The specs also included a certain value of shock factor based on the shape of the pressure spike which also had to be below the given value listed in the specs or the part would be rejected. After developing a new valve design, the manufacturer required a highly accurate test system to prove the new parts were operating to spec. That’s when they contacted CAS DataLoggers to work with them to develop a unique test stand for valve condition monitoring. This multi-point test setup would require a highly accurate data acquisition and control system that could operate in real-time, making calculations as each measurement was processed.
System Design
CAS DataLoggers Engineering Manager Terry Nagy worked with the manufacturer to develop a directional control valve shock factor test system. This semi-automated test stand is designed around the ADwin-Light-16 Real-Time Data Acquisition and Control System together with a touchscreen industrial computer. The touchscreen display is mounted on the front of the enclosure and features an on-screen keyboard for data entry. An Ethernet port allows the PC to connect to the in-house network for data storage, transfer and printing.
The computerized system is mounted in a NEMA 4 enclosure which houses the PC, data acquisition system, pressure sensor signal conditioners, optoisolator modules, and the power supply. Power to the main enclosure is 120 VAC, single phase, 60 Hz.
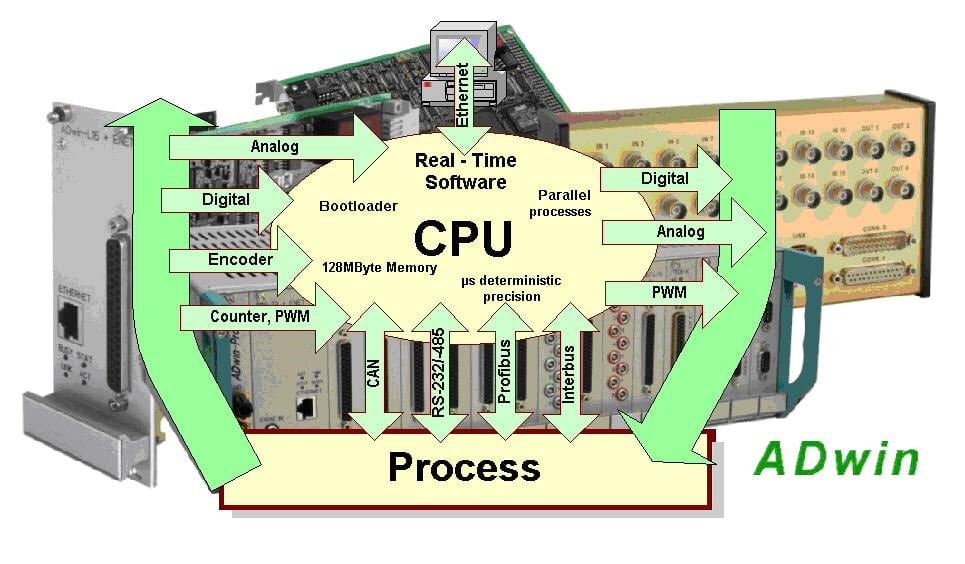
 The ADwin system used here is an intelligent real-time data acquisition and control system performing an electrical measurement, featuring 8 16-Bit analog inputs, 2 16-bit analog outputs, and 6 TTL/CMOS compatible digital inputs and outputs. The system also utilizes a local 32-Bit SHARC DSP with its own local memory to handle system management, data acquisition, online processing, and control of outputs. Several system configurations are available including PC plug-in cards, USB, and Ethernet stand-alone units.
The manufacturer’s pressure transducers were hooked up through connectors compatible with the existing connectors on the pressure sensors to facilitate the easy exchange of sensors. Additionally, 4 signal conditioning modules were supplied with the ADwin to provide excitation and amplification for the 2 mV/Vsensitivity pressure sensors. CAS DataLoggers also provided a pair of optoisolator modules to interface between the ADwin system and the 28 VDC pilot valves.
Test Operation
 The test was designed for small production runs of 20-50 parts. First, an operator connected the unit under test to the test station and started the test execution software on the PC using the industrial touch screen LCD display panel (rated IP-65) and on-screen keyboard. Users then entered the valve’s serial #, the appropriate sequence (detent or non-detent), and the correlation factors for each percentage for proper calibration during test operation. Test Information included operator name, date, part #, part serial #; Cycle Timing; and ADwin Settings. During the test, users could also view the pressure against time on an on-screen graph.
The test program stepped through the test sequence using the appropriate limits, actuated the relays for the supply valve, automatically collected pressure information, and calculated the surge peak pressure and shock factor and pass/fail information as required.
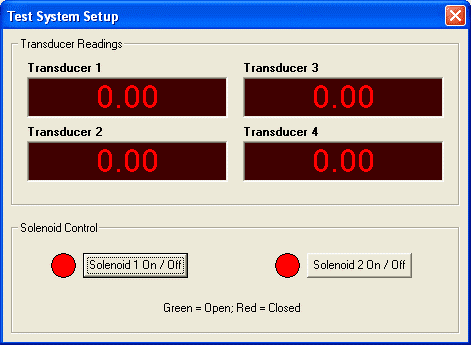 The interface gave users an overview of the test data from the transducers during test execution; each test lasted for 10 cycles, ie a 10-second period of time. During operation, the display graphed the data from the last cycle portion, its maximum valve pressure, and the maximum shock factor calculation for the cycle portion’s data set. Meanwhile, a status bar displayed the cycle, a portion of the data being displayed, and the valve settings for that data set.
The ADwin-Light-16 system enabled valve condition monitoring with the ADbasic software, which defined the processing sequences executed on the hardware and enabled the programming of mathematical operations and functions which were executed immediately after each sampling step. Using ADbasic, engineers optimized and compiled the program code with a mouse click. After being loaded on the system by ADbasic, the real-time processes are executed independently. ADbasic contained the functions to access all inputs and outputs as well as functions for floating-point operations, process control, and communication with a PC. A library was provided that contained standard functions such as filtering, various examples for counter use, closed-loop controllers, function generators, etc. which lead to a faster program implementation.
The ADwin generated graphs that plotted the data on 2 axes: Pressure (p) and Time (t). The graphs showed a point-by-point derivative used to calculate the slope of the data. The ADwin real-time DAQ system also calculates the peak pressure and shock factor. The shock value is calculated by a quick formula: Differential Pressure (DP) / Delta Time (DT). The results of each test were stored in a data file and were also available as a final report that could be printed when the test was complete, giving all of the test results.
Benefits & Value-Added Support
The test stand CAS DataLoggers helped the vendor develop this unique application of valve condition monitoring performed exactly as it was intended. CAS DataLoggers provided all the measurement instrumentation for this application and helped design, manufacture, assemble, program, debug and test-run the system. CAS DataLoggers Engineer Terry Nagy provided technical support, and onsite training, and also developed the PC-side user interface. The assembled system was successfully demonstrated at the customer’s site by executing a full test plan on a known good valve and simulation of 2 failure modes.
ADwin was the ideal solution here as it contained its own real-time operating system so it could run independently of a PC. This way it could maintain the high accuracy this test bench application needed to ensure the vendor always delivered an up-to-spec part. Processing of each measurement occurred immediately after acquisition thanks to ADwin’s onboard SHARC DSP. This way the manufacturer is able to validate the quality provided to their customer. The application collected and stored all relevant test details in files for archive and report generation. If the vendor had tried to use a DAQ system based on MS Windows, users wouldn’t be able to maintain the required timing accuracy because Windows processors have to multitask while attempting to keep pace with calculations, i.e. they don’t run independently of the PC as ADwin does.
For further information on the ADwin-Light-16 Real-Time Data Acquisition and Control System, valve condition monitoring or to find the ideal solution for your application-specific needs, contact a CAS Data Logger Application Specialist at (800) 956-4437 or request more information.