
The Basics of Monitoring Productivity, Equipment Monitoring, and More
 Just as with monitoring of other values such as equipment temperature, power factor and vibration, there are varying levels of detail when it comes to run time/event monitoring.
At CAS DataLoggers, many of our callers want to see how often one or more of their machines are working and when. Often their goal is to pinpoint the duration and cause of machine downtime—is it a case of poor work productivity, or is there another cause at work?
In our latest White Paper, we examine several runtime applications and discuss typical solutions which record, store and analyze the data.
Introduction
Monitoring Runtime:
There are several business-critical reasons for technicians in plants and factories to monitor runtime:
A common application is recording Motor Runtime. Users can deploy a runtime data logger to automatically record whenever the motor turns on and off. A multichannel data logger, for example, can monitor 4 to 8 motors or pumps using this method. Meanwhile a ‘smart’ logger can also perform calculations, collects data by shift, runtime duration, log a specific period such as a half-hour block each day, etc.
Production managers can examine this collected data in detail to answer important questions such as ‘Why was the machine off for this duration? Is this due to routine maintenance or due to a lack of productivity?’
While most basic data loggers typically don’t get into this level of functionality, there are many models of intelligent devices which can monitor run time. To monitor runtime, these devices feature one or more digital channels.
Monitoring runtime can be as simple as attaching a small event data logger to a motor to measure its electrical field (for monitoring motor runtime, etc.). For example you can use a simple current switch on a power lead or whatever is turning the machine on and off. You can then view the cycle counts for switches on that machine within specific time periods.
However, if your application is more complex, such as viewing high-accuracy data in greater detail, you’ll need to use a more advanced method of measurement. Likewise, the number of points you need to monitor is a major factor to consider before you begin. For a large-scale runtime application example, if you have twenty or more machines located near each other, you can use a high-channel system to log each motor or piece of equipment.
Monitoring Events:
There is a wide variety of event data loggers designed to record the state of digital inputs (pulse output devices, relays and switch closures) or to measure changes in the state of these inputs as a time-stamped event. These devices are an inexpensive way to record one or just a few signals.
For applications requiring greater measurement flexibility, users can record analog data on a multichannel device equipped with universal analog inputs, while also recording digital data.
These devices are ideal when measuring a mixture of different signal types such as a boiler’s temperature, water level, and the state of a heater relay.
Totalizing Runtime:
 Many runtime monitoring applications require totalizing to calculate volume, event counts or the total energy produced or consumed. A smart logger’s totalizing capability can also derive runtimes and current levels.
Using the calculation capabilities of smart loggers, users can capture cumulative totals of measurement values while also running a total over a particular period of time (day, week, month etc.).
There are two types of signals that can be totalized:
- Analog signals (readings from a thermocouple, for example)
- Digital signals (such as those from a switch)
In some cases all that is required is to accumulate the total since the start of the program, while other applications may require a daily, weekly or monthly total. The technique to totalize each is slightly different.
When totalizing analog signals, a common application involves reading a flow meter (which provides a 4-20 mA output) to display the instantaneous Flow Rate and then integrating this flow rate to derive Volume.
Totalizing a device with a digital pulse signal output is easier than with a sensor with an analog output. With many logger models, digital inputs can be used as a counter input to measure pulses. These counters can automatically accumulate the number of pulses, so they can provide a direct output of totalized flow. If you need to measure higher-speed pulses, high-speed counter inputs can measure pulse frequencies, say 10 kHz.
Counter inputs also commonly have a resetting mode whereby they are reset to zero after each time they are read. In the logger software, it’s possible to combine this resetting mode with a channel variable to provide an accumulating counter. This way, the counter is read, added to the totalized count that is contained in a variable, and then reset to zero to start the next count interval.
Example Runtime Applications
Monitoring Productivity:
Productivity assessment is a common application in manufacturing and production environments, enabling users to accurately gauge operator productivity. Typically, these applications use a data logger’s counter inputs to designate machine status as ON or OFF, while also recording the duration of each. This data can then be used as a valid productivity indicator.
As an example, users can connect split-core current transformers to the motor leads of individually-operated machines in a factory to gather productivity data. For example, the sensors could monitor a specific current range, say 15-20 amps. Any reading under 10 amps may indicate that the machine was idle at the time the data was sampled.
Viewing this data by specific shifts, users can then see which machines are only operating at say 50%, and subsequently find out whether the machine needs to be overhauled or if user error is the cause. Users can also compare this data with the number of parts and the scrap produced that day to determine productivity.
A programming interface can enable quick implementation: for example, the counter can show either a ‘Running’ result of 1 or an ‘Idle’ result of 0. By viewing days or weeks of runtime data, users can check for optimum machine usage.
However, in the real world, ROI means the ability to present data meaningfully to management. Report generation is a useful logger software feature which accumulates the total minutes, exports in .CSV format to applications such as Excel, and makes the data easy to present to management. This is an efficient and accurate way to gauge productivity and meet quotas across multiple shifts each day, saving on long-term costs and/or helping to ensure a long-term productivity boost.
Monitoring Power Consumption:
 Compressed Air is the main source of power consumption in many manufacturing facilities. As manufacturing capacity expands, compressor capacities also increase to meet the greater power demand. However, if a compressor is too large for the job, it will only operate occasionally and draw a lot of power even while idling.
Both runtime and current consumption can be measured on a wide range of compressor models. Users can attach a current clamp around the compressor’s supply, and with the use of a data logger with a display, can view data to see when each compressor is operating in the loaded and idle states.
As a result, management and supervisors can realize substantial energy savings from viewing this electrical data, such as how long this equipment is running during a given day. For example, at the end of the recording period, you can use the data as part of energy survey to determine if each compressor is the correct size according to its use.
Another major savings opportunity comes from lowering your facility’s Power Factor, so that your provider won’t charge large fees resulting from using too much reactive power (expressed in kVAr). See Figure 1 below.
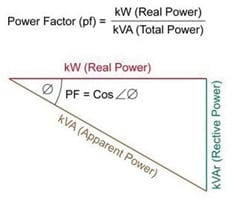
Figure 1: Calculating Power Factor
Troubleshooting:
Industrial machinery and processes are usually controlled by PLC (programmable logic controller) systems or industrial PCs. But what are your options when the program malfunctions, or when erratic operation and failures start to occur?
Condition monitoring is an effective way to predict and prevent machine and process failures. This usually involves continual sampling of temperature and other data to spot early indicators of problems. Meanwhile, in cases of an existing issue with an unknown cause, troubleshooting (fault diagnostics) can be performed.
Troubleshooting usually requires fast sampling of the relevant analog/digital signals in parallel to existing systems. A signal sequence diagram is especially useful in providing an overview of the chronology of a malfunction event. For effective analysis, this can be done in combination with software logic diagrams.
Transient signals are extremely high-speed events which, if captured by a data acquisition system, enable precise identification of the sequence of events in a malfunction. In these applications, either the logger can be set to sample data continuously (ideal for periodic events), or instead be triggered by specific events (ideal for event-dependent problems).
Data acquisition systems can evaluate pressure pulses, monitor processes, and optimize controllers. Using synchronous sampling, data from both analog and digital sensors and actuators can be simultaneously acquired. These systems can operate in conjunction with a PC or record in ‘standalone’ mode, i.e. without PC support.
Data Retrieval and Storage
Data collection is handled in a variety of ways including USB memory stick, Ethernet ports, and RS232 with modem support. In this way users can choose to connect to the data logger locally, remotely or online. With many models, users can also send the data via FTP (File Transfer Protocol) for convenient downloads and program transfers.
For example, many models of data acquisition systems are able to transmit recorded data to a PC via an Ethernet interface where it can then be saved and viewed online.
Visualizing and Analyzing Data
Commonly, data logger software uses an integrated graphical interface to display data. Users can typically configure the data logger, view real-time data, generate charts and tables, and view historical data for analysis. Users can often configure tabs for Event, Scaling, Statistics, etc.
When performing data analysis, recorded signals can be portrayed live in y(t) diagrams (aka cause and effect diagrams). With up to 1000x higher time resolution when compared against a SCADA system, even large volumes of historical data can be analyzed.
Many software packages also contain a driver library for popular applications including MATLAB, DIAdem, etc.
Example Run Time Monitoring and Totalizing Application
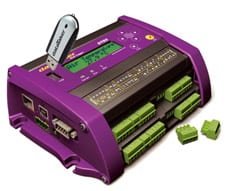 Our example runtime monitoring program uses an intelligent dataTaker DT80 data logger to read machine run data from the logger’s two digital inputs. Our program shows how to set up a few simple calculations of machine runtime and On/Off events. This is done by creating data logging schedules which run every second, taking a sample from the DT80’s Digital Sensor Channels 1 and 2.
The DT80 logger features universal analog inputs, digital channels, high-speed counter inputs, and programmable serial sensor channels for connection to most sensor types. With this system, current, event and runtime can all be logged and archived.
This project requires motor starters with auxiliary contacts or auxiliary relays that can be placed in parallel with the coil on the main motor relay.
For the initial setup, first connect the auxiliary contacts from each pump or motor you want to monitor to each of the data logger’s digital inputs and DGND terminals (DGND being a common ground).
Once this setup is completed, open the logger’s dataTaker dEX software and create a data logging schedule for each of the motors/pumps to be monitored. Schedule creation is a quick way to tell the logger when to sample data from each connected sensor.
Now create a new schedule that triggers once an hour with calculation channels equal to the number of pumps or motors, and for each channel put xCV in the calculation text line. (where x is the number of the pump or motor, while CV stands for ‘Channel Variable’).
Afterward, create another schedule that triggers once every 24 hours and which has calculation channels equal to the number of pumps or motors. These will calculate the total runtime.
Defining the Schedule:
Schedule 1 shows example data and code to add this functionality. It consists of:
- Counter1_1State: Code = 1MODBUS(“Machine1Power”,AD11,R4:9,=1CV) (This line returns a 1 or 0 value for Channel 1 to indicate if the machine is currently running, i.e. its On or Off status).
- Counter 1_2State: Code = 1MODBUS(“Machine1Move”,AD11,R4:10,=11CV) (This line returns a 1 or 0 value for Channel 2 showing if the machine is currently on or off).
- Counter1_1OnTime: Code = IF(1CV>0.5){2CV=2CV+1} (This line gives the duration of time that the machine has been on, measured from the last recorded sample)
- Counter1_2OnTime: Code = IF(11CV>0.5){12CV=12CV+1}
Totalizing Run Time:
Our dataTaker has also been programmed to calculate and display Total Machine Run Time. Every night at midnight, the logger generates runtime on/off totals and runtime totals for that day. This data is given as ‘PreviousDay1_1On’ and also as ‘PreviousDay1_1Off’, and for runtime, it’s ‘PreviousDay1_2On’ and ‘PreviousDay1_2Off’. This allows users to compare runtime across many different days to spot trends.
Meanwhile the calculations are named Machine OnTime, OffTime, MoveTime and NoMoveTime. All are expressed in seconds.
When it generates these daily totals, the dataTaker also resets all counters, having been programmed to do this so that it can count the new day’s total anew.
For further information on Run Time and Event Logging, or to find the ideal solution for your application-specific needs, contact a CAS DataLoggers Application Specialist at (800) 956-4437 or visit our website at www.DataLoggerInc.com.