
Data Collection, Storage and Transmission
Introduction
Recent local, state and federal mandates such as RICE NESHAP require the reduction of harmful emissions (both particulate and NOx) from diesel engines used in off-road equipment, generators, buses and construction equipment. A variety of control technologies exists, but each is best suited for a specific engine use map, and a key part of retrofitting this equipment is collecting data to determine this use map. After the emissions reduction equipment has been installed, it’s also necessary to monitor engine performance to make sure that the equipment has not adversely effected the operation on the engine. Authored by CAS DataLoggers, this paper will review the data logging requirements for this application, the sensors required, and sensor mounting considerations.
Application Overview
Addition of new emission requirements for diesel engines has necessitated an industry-wide need to monitor and record engine operating information including:
- Exhaust back pressure
- Exhaust gas temperature
- Engine RPM
- Engine load, throttle position, fuel consumption and other operating data
Why do these parameters need to be monitored? There are 2 main reasons: First, users need to view the engine operating conditions to determine which of the available emissions reduction strategies is the best fit. The optimal method depends on typical engine load and duty cycle, exhaust gas temperature and other operating parameters that are specific to the way the engine is being used.
Once this equipment is installed, it’s important to collect enough data to ensure that the control equipment does not cause the engine to operate outside its design limits. For example, a clogged particulate filter can lead to abnormal exhaust back pressure which will reduce engine performance and can lead to overheating and damage.
Equipment Requirements
A typical monitoring system will include at minimum a data logger, a thermocouple to monitor engine exhaust gas temperature, a pressure sensor to monitor exhaust gas back pressure, and an engine RPM sensor. In some cases, a second pressure sensor will be added to monitor the differential pressure across a particulate filter. Engines fitted with a turbocharger or supercharger can be fitted with a boost pressure sensor. Modern engines with an electronic control unit (ECU) often have a CANbus interface available that allows for the collection of many engine operating parameters. Finally, some systems that are used in mobile applications require the collection of GPS information to track location information used to determine what specific pollution control district the engine is being used in.
Datalogger Requirements
The typical application will require 2-5 analog input channels for connection with the different temperature and pressure sensors. If engine RPM will be used using one of the sensors described below, a counter or frequency input will be required for pick-up. Most applications for the loggers will be in-vehicle, so operation from 12 to 24 VDC vehicle power is advantageous. Equipment vendors often ask for digital outputs for alarms, visible or audible, to warn the operator if the engine is operating outside of its design limits.
Obviously, a PC interface is needed both to configure the data logger and to download all recorded data. Traditionally, serial (RS-232) interfaces were common, but many new computers do not include serial ports and today USB is the most common communication interface. Ethernet is also a popular communication method although configuring network addresses is a little more involved than USB “plug and play.” The inclusion of an interface for a removable USB stick or Compact Flash card provides a very convenient way to unload data when it’s not practical to hook up a PC to the logger in the field.
Typically, it’s required that the logger be able to collect and store data locally for 1-4 weeks of data. For an application where the recorder is collecting 3 inputs (exhaust temp, exhaust back pressure and RPM) at 1 second intervals for 8 hours a day, this means that the logger must be able to store 500,000 to 2 million data points.
Additionally, it’s often very desirable to have remote monitoring capability to view equipment operations. A variety of cellular and satellite modems are available that provide the ability to remotely connect to the system and view real-time and/or historical data. In this case, the data logger must incorporate a communications port to interface to modem, with RS-232 being the most commonly used interface.
Exhaust Gas Back Pressure Sensor
Exhaust gas back pressure is normally in the range of 0-2 PSI. While it’s possible to use a sensor with a 0-50 PSI range, it may not produce the required accuracy since it will be operating at a fraction of its full scale range. At CAS DataLoggers we typically recommend 0-5 or even 0-2.5 PSI–the small incremental expense is well worth the improved accuracy.
When mounting the sensor, there are 2 key points we must stress: First, the sensor must be protected from direct exposure to the hot exhaust gas. These pressure sensors typically employ a thin diaphragm with a piezoresistive bridge to measure its deflection. Because of this, the sensor output will be temperature-dependent and direct exposure to the hot gases will cause unwanted measurement errors. Fortunately, the solution is simple: simply mount the sensor on a length of small-diameter tubing to provide a buffer to protect it from the exhaust gas stream. We typically recommend a piece of ¼” O.D. tubing a minimum of 18” long.
Second, the pressure sensor should be mounted with the outlet facing down to prevent contamination accumulating in the sensor. The exhaust stream can contain moisture which can condense and when combined with the chemicals in the exhaust gases lead to the buildup of acids that can damage the sensing diaphragm.
Exhaust Gas Temperature Sensor
By far the most common exhaust gas temperature sensor is the Type K thermocouple. These are suitable for temperatures up to 1000°C (1832°F). Here we recommend using probes with a stainless steel sheath (avoid inconel or other materials as it may react with exhaust gas). By using a probe with a ¼” O.D., a standard swage type fitting can be threaded into a tapped hole in the exhaust pipe to provide a leak-tight installation. To reduce interference from other signals, use an ungrounded probe to isolate the thermocouple junction. Also, because of small signal voltage level, use shielded cable with one end connected to chassis ground to reduce the effects of EMI and RFI interference.
RPM Sensor
Our Applications Specialists have identified 3 strategies for measuring engine RPM:
1. Reflective or interrupting optical sensors
2. Proximity sensors
3. Frequency transducers that monitor the alternator output
Your choice of which method to use is often driven by cost and installation considerations. The last method, using the residual ripple in the alternator output which is proportional to RPM is very easy to install–simply connect a wire to the alternator output. However there is additional cost for the signal conditioning electronics and there is some calibration that is required since this signal will be some harmonic of the engine speed. Reflectance or proximity sensors are very easy to use since they can provide the RPM directly as a pulse output of the correct frequency, but it is often more difficult to locate and mount the hardware.
CAN Interface
The typical vehicle or engine ECU can provide a wealth of performance information via the vehicle bus. Heavy duty and off-road engines generally have a J1939 CAN bus interface that can be configured to read RPM, engine load, throttle position and dozens of other parameters. These are often very useful in selecting the optimal emissions reduction strategy for a particular application. To interface to the data logger, a CANbus to serial gateway provides an easy to use solution. The gateway can be configured to capture standard CAN messages, extract the parameters of interest and format them, which offloads much of the work from the datalogger. Often the hardest task is coming up with an interface cable as there seem to be a variety of “standard” CAN connectors including 6 and 9 pin Deutch, OBD-II and proprietary. We often find that the easiest way is to make a pigtail and splice directly into the connector.
GPS Tracking
To provide GPS tracking information, an off-the-shelf GPS sensor such as a Garmin GPS-18 with a serial interface can be easily integrated into the system. Using the standard NEMA output format allows for turn-key generation of logger configuration commands to read latitude/longitude, altitude, heading, and speed. When mounting the GPS receiver, it’s important to note that it must have a relatively unobstructed view of the sky which requires that it not be mounted in a metal enclosure or metal compartment that shields it. When used in conjunction with a tool such as Google Earth, GPS data combined with other sensor data can provide a very intuitive map of engine operating parameters vs. location.
Measurement Program Description
The data logging program is straightforward. Typically the data logger is set to record temperature, pressure, RPM and possibly CAN parameters at 1-10 second intervals while the engine is running. Several methods are employed to start and stop logging. Obviously, the logger could simply be powered from a source that is switched on and off by the ignition, but switching off the device in the middle of a sample can cause data corruption. It’s much better to use an external trigger to enable and disable logging. One way is to setup the logger to continuously monitor a parameter that indicates the engine is running (either the exhaust gas temperature, vehicle power line or RPM), and then enable or disable the main sampling schedule when the engine is on. For example, the program can monitor the exhaust gas temperature once a minute and only log while the temperature is above 200°C (392°F), a value that indicates the engine is running. Another technique is to use one of the digital trigger inputs connected to the vehicle switched power through appropriate signal conditioning to enable or disable logging. Either of these 2 methods allows the logger to only record useful data and still shut down without issue when the vehicle is turned off.
Some customers also require audible and/or visual alarms to indicate if one of the key parameters–either exhaust gas temperature or back pressure–is outside of preset limits. As part of the normal measurement schedule, the data logger can compare measured values against programmed limits and using a digital output to actuate the alarm. The logger also has a delay capability so that the alarm condition must be true for a period of time before the alarm is activated to prevent false triggers in cases where the condition is true for only an instant.
Data Retrieval
In most of these applications, the logger will be allowed to collect data for 1-4 weeks and then the stored data is downloaded to a PC for analysis. Several different methods are employed to retrieve the data including direct connection to the data logger, transfer to removable media and remote communication via a modem.
As described above, directly connecting a PC to the logger and using the vendor supplied tools to unload the data may be the easiest way to retrieve the stored information, but it is not always the most convenient. In some cases the logger is installed in a vehicle that may be in a remote location, or it may be impractical to pull the equipment out of service for a period of time while the data is unloaded.
Removable storage devices provide an alternative to downloading the data to a PC. This way the logger can be configured to store all of the information directly on a USB or compact flash card. These can then be periodically swapped out (in some cases by the equipment operator) and then taken back to the office where the data can be uploaded to a computer.
The other alternative is to use a cellular modem to provide remote access to the logger. Currently there are 2 popular cellular technologies, CDMA and GSM/GPRS. The CDMA is an older technology that offers the best coverage area but occasionally has slower data transfer rates. GSM/GPRS cellular coverage is a bit more limited, but is available in most metropolitan areas. In either case, we found that using data plans with a fixed IP address provides for the easiest setup and most robust communication. In this case, connection to the logger becomes as easy as if it was on your desktop.
Data Analysis
One factor that is often overlooked is what to do with the data once it has been collected and uploaded to the PC. It’s quite easy for data loggers to generate large data files that swamp programs such as MS Excel which has a 65,000 row limit. Typically, software tools supplied by data logger vendors allow larger data sets but are limited in their analysis features.
Working with customers, we have found several alternative approaches. In many cases the best is to reduce the amount of collected data. As simple as it seems, this is often overlooked. Typically, what users actually need are not individual data samples but rather summarized data such as the average value, minimum/maximum values, and other statistical information that describes the data. In this case, using a data logger which can perform the statistical reduction on the raw samples dramatically reduces the amount of data to be stored and transferred.
If users really do need to look at all of the raw data, another alternative is to use more powerful analysis tools such as Flexpro or Origin. To facilitate transferring the data to these programs, it’s essential that the data logger software be able to output data files in an open format such as .CSV (comma separated value).
 Example Data Logging System
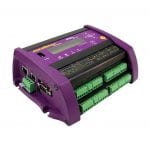
At CAS DataLoggers, we have delivered several dozen systems for this application that meet the requirements discussed above. These solutions incorporate a dataTaker DT80 data logger as the workhorse of the system. This logger has 5 analog input channels that can accept up to 15 sensor inputs depending on sensor type. These systems are outfitted with a type K thermocouple probe and 1 or 2 pressure sensors. To monitor CANbus parameters, a CANgate serial to CAN converter is connected to the dataTaker’s serial sensor input. The CANgate also accepts GPS data from a standard Garmin GPS-18 receiver. Additional analog, digital and counter inputs on the data logger provide the flexibility to add additional sensors and trigger inputs. The data logger, CANgate and cellular modem are packaged in a NEMA enclosure to provide environmental protection. These systems are used in a wide variety of vehicles including school buses, transit buses, cranes, and snow-cats.
Summary
The collection of diesel engine operating data is currently a very active application driven by various government mandates to reduce harmful emissions. As is typical of most data logging applications, there are a number of considerations in assembling a system to collect this data including:
1. Defining which parameters need to be monitored
2. Data logger selection
3. Sensor selection
4. Sensor mounting and electrical connections
5. Data logger programming
6. Alarm indication (if required)
7. Data retrieval
8. Data analysis
This paper sources our experience gained in each of these areas from multiple installations at different customer sites across the US. For more information about diesel engine emissions monitoring, contact a CAS Data Logger Applications Specialist at (800) 956-4437.