
 Summary: Experimental data was collected to examine the behavior of RTD probes inserted in various thermal buffers in refrigerator and freezer applications. From the warm-up time vs. temperature curves, a thermal time constant was determined by fitting an exponential line to the data. Also, the behavior of the buffers during typical operation as the refrigeration compressor cycled on and off was observed. Using this data, a comparison of the thermal buffer effectiveness and recommendations on the buffers for refrigerators and freezers are made.
Introduction
There currently exists a considerable amount of confusion in hospitals, clinics, and the healthcare industry about the use of temperature buffers on probes attached to Digital Data Loggers (DDL) placed in medical refrigerators and freezers. There are no clear indications of which types are most effective due to a lack of published data on the relative performance of the various alternatives. While no official test results have been published, the CDC has recommended the use of glycol bottles in medical refrigerators to provide thermal buffering for probes and most closely approximate the temperature of products for monitoring purposes.
With this in mind, we at CAS DataLoggers conducted our own study of thermal buffer behavior in a refrigerator and freezer, collecting data on the performance of solid nylon blocks, liquid glycol, and glass beads. This white paper is intended to provide experimental data on the performance of the different alternatives available.
The aim of our study is to give a detailed look at the buffered temperature curves we obtained, analyze the specific response in both types of units, and provide data that can be used to help select the most appropriate buffer type (or to discern if they were equally effective). We’ll compare the response rate of all three buffers, looking for significant differences. Ideally, we want to identify the insulator type that offers the probe a response time to most closely resembles what is happening to the bottle, vaccine, or product under monitoring. Too fast a response time and there will be nuisance alarms due to door openings or compressor cycling; too slow and the product may be damaged before someone is alerted.
 In this paper, we specify our methodologies and equipment in detail so the test is easily reproducible.
Background
As the CDC has pointed out, recording and tracking temperature history via a DDL is the best way for medical staff to know if stored vaccines, medications, and other products remain safe and effective for use during storage. For example, the CDC’s minimum requirements for vaccine monitoring in refrigeration units include that vaccine temperatures be continually maintained between 2° and 8°C. Therefore, an accurate temperature history that reflects actual product temperatures is of utmost importance to effective temperature management. While traditional mercury thermometers have been used in the past, present guidelines call for the use of electronic temperature monitoring devices such as dataloggers or electric thermometers which are connected to temperature sensors. Because of their very nature, mercury thermometers have a relatively slow response time while electronic measurement instruments and their probes can respond several orders of magnitude faster. While there are several ways to dampen the response of the latter, a common method is to place the sensors within a buffering medium (fluid, solid nylon, glass beads) to slow the thermal response rate to more closely match the product being monitored. For example, solid nylon buffers are commonly used in cryogenic storage applications to compensate for the rapid increase in air temperature when a storage container is opened.
Regarding temperature probe buffers in refrigerators used for medical monitoring and life science applications, the Center for Disease Control has stated that: “Temperatures measured by a buffered probe match vaccine temperatures more closely than those measured by standard thermometers, which tend to reflect only air temperature.” However, there is a lack of published data supporting this recommendation, leading to considerable confusion across the industry as to which configurations are best for which applications and storage units. For example, many users in hospital and clinical settings believe that nylon blocks are best to use in freezers, while others maintain that glass beads make the best buffers for refrigerators—all in the absence of citable data.
Regarding which type of temperature buffer to use, the CDC Vaccine Storage and Handling Toolkit, which was updated in 2021 to add information relevant to the Covid-19 vaccine state: “ DDLs using a buffered temperature probe provide the most accurate way to measure actual vaccine temperatures” but does not provide a specific recommendation between glycol, Teflon, glass beads or any of the alternative buffer types.
The CDC’s presentation entitled, “Guidelines for Storage and Temperature Monitoring of Refrigerated Vaccines” is more specific and recommends using a glycol bottle for refrigerator applications and further specifies: 10 probe diameters of immersion, a bottle width of greater than four probe diameters, a minimum probe clearance of 1 to 2 cm off the bottom of the bottle, and a sealable lid such as a septum cap. CDC also recommends that users tape or cable-tie the probe cable to the outside of the bottle to prevent the probe from shifting around in the refrigerator. NIST studies have demonstrated that temperature probes in glycol-filled bottles can more closely approximate vaccine vial temperatures when placed in the same refrigerated area where the vaccine is stored. Therefore the refrigerator portion of our study rigorously adhered to all the above guidelines.
While the CDC Vaccine Storage and Handling Toolkit do not contain a recommendation for setting alarm limits, the CDC presentation mentioned above specifically states that refrigerator alarms should be set at 2 and 8° Celsius. However, if users respond to an alarm and the temperature has drifted even a little further, this results in a reportable temperature excursion. To avoid this and further protect their products, some users set their alarms at 3 and 7°C–or even narrower if they have good medical-grade refrigerators that will hold the temperature within a tight range.
Description of Experiment
We conducted this study over a period of several days to acquire the freezer and refrigerator temperature data. All measurements were taken using four (4) identical industry-standard 100-ohm RTD probes. The test involved placing a probe in two (2) bottles, each containing a different temperature buffer with the same immersion. A third probe was placed in a nylon block. We also used a probe without a buffer or bottle (i.e. the ‘bare probe’) as a control to obtain baseline readings.
In our study, we also adhered closely to CDC Guidelines asking users to verify temperature stability using a digital data logger thermometer with a total device accuracy (i.e. uncertainty) of +/- 0.5°C. CDC also calls for probes to be calibrated to a NIST-traceable standard. In this study we used calibrated probes with an accuracy of about +/-0.3°C within the 2 to 8°C range; after adding the instrument error of about 0.1°C, we estimate that our accuracy is +/- 0.4°C and therefore within the CDC range.
We recognize that some users prefer to use propylene glycol in refrigerators as a thermal buffer per CDC recommendation, but we chose ethylene glycol because propylene glycol freezes at -20°C, presenting a problem for use in freezers. As a uniform material, ethylene glycol was more appropriate for the freezer portion of our test. We also adhered to CDC guidelines regarding optimal probe placement–for example we avoided poor practices such as placing probes near the refrigeration coil since that location would exhibit the greatest temperature variance.
Test Setup
Refrigerator/Freezer:
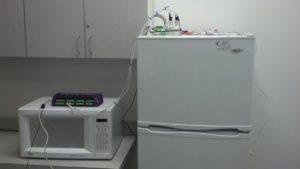
The freezer portion of the test was conducted in a Whirlpool residential top-mounted refrigerator unit maintained at -20°C. The refrigerator portion of our test was conducted in a Holiday under-the-counter refrigerator maintained at 4-5°C.
Data Logger:
We used a Series 4 dataTaker DT85 Universal Data Logger for data collection, storage, and analysis. Connected to all 4 temperature probes via its analog inputs, the dataTaker records the resistance of each probe and converts this data into temperature values. These readings are automatically stored on the datalogger’s internal memory and sent to an office PC over Ethernet. The data logger also provides the ability to compensate for any errors caused by the resistance of the lead wires by using a probe with 3 wires and applying an internal correction algorithm to subtract the lead resistance from the measured value.
Sensors:
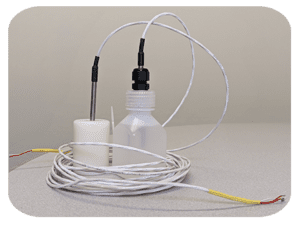
We used 3-wire PT100 (i.e., 100 ohms at 0°C) RTD assembly temperature probes, consisting of a thin-film platinum element encased in a 3-1/2” long x 3/16” diameter stainless steel sheath. A short length of heat-shrink tubing covers the transition between the tube and the cable jacket. Each probe’s cable length extends to 10 feet.
We placed an RTD probe into each of our three (3) temperature buffer types and left the fourth exposed to the air to record the room’s ambient temperature for comparison:
Temperature Probe Buffers:
- Bare Probe: As our control, we left one of our RTD sensors exposed to the air without a temperature buffer of any kind. This probe would by definition have the fastest response time.
- Nylon Block: We used a 2” long nylon block with a 1 ¼” diameter. The RTD probe tip is centered in the block with a drop of cyanoacrylate adhesive on the tip for a snug fit.
- Glycol Bottle: We used 60ml of ethylene glycol (tech grade 99.9%) inside a 60ml bottle, 1 ½” square, with the RTD probe immersed 1 1/8” deep in the fluid.
- Glass Beads: We placed 60ml of glass beads sourced from McMaster-Carr (100-170 mesh) inside a 60ml bottle, 1 ½” square, with the probe immersed 1 1/8” deep.
Experimental Methods
We then affixed our four (4) variables (consisting of the three (3) buffers and the bare probe) together with a cord in a square array with equal space between probes. Putting the probes in the test chamber and taking them out at the same time helped ensure reliable readings, simplified the time alignment of the data and kept our test free from anomalies that might have arisen from the movement of the probes or their coming into contact with each other.
Once this was done, we configured the dataTaker to take and store a temperature reading from each probe once every 30 seconds. We chose this duration to best capture the real-time changes occurring in the buffers.
To begin our test, we placed this sensor array into the freezer and let the probes cool to equilibrium such that the difference between them was no more than +/- .5°C. Subsequently, we removed the array from the storage unit to an isolated spot (minimizing the effects of air blowing by, etc.) and let the probes come back up to room temperature. In this way, we equilibrated the probes to the ambient environment to simulate the temperature changes when the freezer door is opened, when medicine or vaccines are removed, or when there is a failure in the refrigeration unit.
We replicated this exact structure in the refrigerator portion of our test so that the data would be comparable. We repeated each test several times to gauge the repeatability of the data.
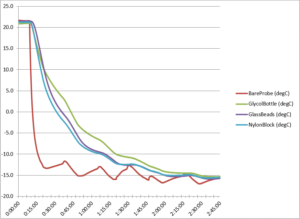
Figure 1. Freezer cool down temperature curve
The data in Figure 1 above shows how the bare probe and the 3 types of temperature buffers cooled at differing rates in our freezer. As expected the bare probe gave much lower readings than any of the buffered probes which were naturally slower to respond to the temperature change. For much of the test, the glycol probe was the slowest to cool down.
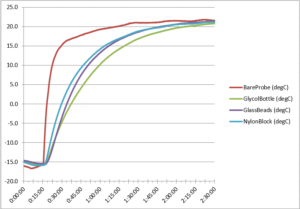
Figure 2. Freezer warm-up temperature curve
After obtaining the cool-down temperature curves, we measured the freezer test’s warm-up curve. This data shows the differing rates at which the probes warmed up from roughly -15°C after we removed the probe array from the freezer. As Figure 2 above shows, the bare probe exhibited the most rapid and extreme rise in temperature. The glass beads and nylon block produced similar readings, while the glycol bottle’s probe showed the slowest and least extreme temperature rise.
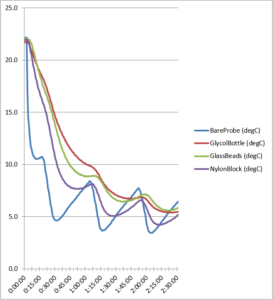
Figure 3. Refrigerator cool down temperature curve
Figure 3 above contains temperature data showing a similar difference in cooling rates among the probes. Again the bare probe exhibited lower readings than all the buffered probes which showed a greater delay in coming down to temperature. Here the nylon block had the lowest value of the buffers while showing the largest fluctuation, while the glycol buffer was the slowest to cool down.
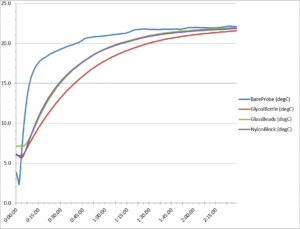
Figure 4. First refrigerator test warm-up temperature curve
We also noted the warm-up curves in the refrigerator portion of our test to be sure our data was representative and reliable. Our two refrigerator test runs showed similar results to the freezer data. In Figure 4 above. we can see the temperature data from the first run of our refrigerator test. Note how the bare probe warms up more quickly than any of the temperature buffers, while the glycol bottle probe is the slowest to rise in temperature.
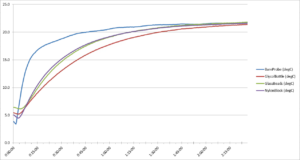
Figure 5. Second refrigerator test warm-up temperature curve
As with the first run, the second run of our refrigerator test (See Figure 5 above) demonstrates that the bare probe displayed the most rapid rise in temperature, while the glycol bottle probe showed the greatest delay in approaching room temperature. The probes within the glass beads and nylon block showed similar temperature readings, neither being as slow to warm up as the glycol bottle probe. The data from the 2 runs are virtually identical which improves our confidence in our experimental methods.
Shortly after the start of this test, the bare probe jumped in temperature with every 30-second reading. As an example, at 4:42:00 PM (16:42:00), the temperature value for the bare probe was 12.52°C, while just 30 seconds later it rose to 13.04°C and was at 13.50°C half a minute after that. These temperature spikes indicate the bare probe’s rapid response to temperature changes.
Meanwhile, shortly after the start of the test, the glycol probe’s readings read the lowest of the 4 probes. Comparing its readings against the above times, we see a slow gradient: at 4:42:00 PM (16:42:00) the glycol probe read at 6.32°C, only registering a slight temperature gain 30 seconds later at 6.50°C, and reading at 6.69°C half a minute later. This curve remained more gradual than either the nylon block or the glass beads. At 4:42:00 PM (16:42:00) the glycol probe read at 6.32°C, only registering a slight temperature gain 30 seconds later at 6.50°C, and reading at 6.69°C half a minute later. This curve remained more gradual than either the nylon block or the glass beads.
We also graphed both results of the refrigerator test for each probe buffer to derive a total probe response time. See Figures 6, 7, and 8 below:
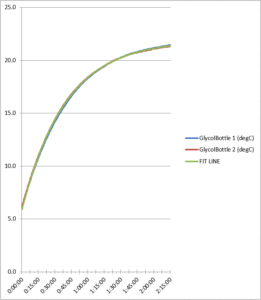
Figure 6. Glycol bottle refrigerator test comparison
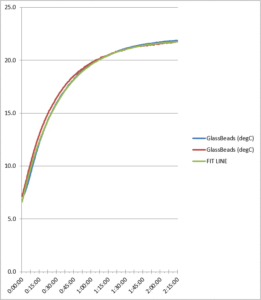
Figure 7. Glass bead refrigerator test comparison
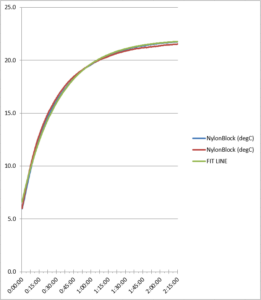
Figure 8. Nylon block refrigerator test comparison
As the data reflects, the two refrigerator test runs produced similar data for each probe, showing the consistency between the test runs. Total probe buffer response times are given in Table 1 below:
| Probe: | Glycol Bottle: | Glass Beads: | Nylon Block: |
| Time Constant (minutes): | 39.71 | 32.38 | 31.83 |
Table 1. Temperature buffer time constants
Freezer and Refrigerator Cycle Data
One issue that users often encounter in the absence of a thermal buffer is that it’s easy for monitoring devices to generate false alarms simply due to the normal cycling of the refrigeration compressor. If the limits are set too tightly, even a small variation in the cycling can trigger an alarm.
From the freezer and refrigerator temperature curves we obtained above, we measured the standard deviation and the peak-to-peak values during normal operation and examined the relative variation among the 3 temperature buffers to determine our results: see our freezer data in Figure 9 below.
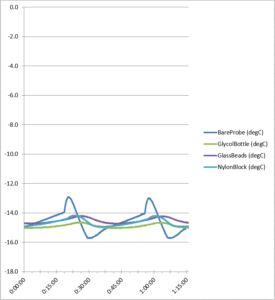
Figure 9. Freezer cycle temperature data
The probe statistics (see Table 2 below) show specific temperatures for each buffer:
| Probe | Bare Probe °C | Glycol Bottle °C | Glass Beads °C | Nylon Block °C |
| Average | -14.61 | -14.89 | -14.52 | -14.65 |
| Minimum | -15.72 | -15.05 | -14.73 | -14.94 |
| Maximum | -12.92 | -14.64 | -14.20 | -14.16 |
| Range | 2.81 | 0.41 | 0.54 | 0.78 |
| Standard Deviation | 0.71 | 0.12 | 0.17 |
0.24 |
Table 2. Freezer test cycle data
Our refrigerator tests showed correlative results with the above freezer data. Throughout the test, our refrigerator cycled every 30 minutes (from 2 to 8°C for example). Often staff set their alarms to trigger at a specific temperature (for example 6°C) but they don’t account for the temperature changes from their refrigerator repeatedly cycling on and off. To make it more complex, different models cycle at different rates depending on their location and many other factors such as room temperature. Looking at Figure 10 below we can see a data set that shows each probe’s standard deviation over two refrigerator cycles:
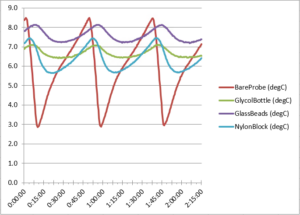
Figure 10. Refrigerator cycle temperature data
Here the bare probe exhibited by far the greatest temperature variation (standard deviation), and this fluctuation would have posed a risk if we had been storing vaccines, for example. See also Table 3 below listing specific temperatures for each probe.
| Probe | Bare Probe °C | Glycol Bottle °C | Glass Beads °C | Nylon Block °C |
|
Average |
6.02 | 6.68 | 7.59 | 6.39 |
| Minimum | 2.85 | 6.42 | 7.19 | 5.64 |
| Maximum | 8.49 | 7.11 | 8.14 | 7.44 |
| Range | 5.64 | 0.69 | 0.95 | 1.80 |
| Standard Deviation | 1.62 | 0.22 | 0.30 | 0.59 |
Table 3. Refrigerator test cycle data
Note that the extreme variation in temperature measured by the bare probe could have caused repeated false alarms in any given clinic or hospital, posing a major inconvenience for staff.
Data and Conclusions
Results of freezer test: The freezer portion of our study (conducted at -20°C) showed that the nylon buffer and glass beads had practically equivalent response times while the glycol bottle showed a slower response time than either of them.
Results of refrigerator test: The refrigerator portion of our test (conducted at 4-5°C) produced data strongly similar to the results of the freezer test, best shown in the warmup curve. Comparing the time constants of each thermal buffer in our two refrigerator tests (given in minutes) shows us their relative response rates after being removed from the refrigerator:
- Glycol Bottle: 39.71 minutes
- Glass Beads: 32.38 minutes
- Nylon Block: 31.83 minutes
As these values show, the probe immersed in the glycol bottle was the slowest to change temperature and therefore gave the best indication of the probe’s true temperature. The glycol bottle probe showed an 18-20% slower response than the other buffers, taking almost 40 minutes to reach the same temperature that the nylon block and glass beads reached after about half an hour (roughly 32 minutes each).
Conclusion
All of our data sets from the freezer and refrigerator tests revealed a substantial temperature difference between the ethylene glycol bottle probe and the probes in the glass beads and nylon block. The refrigerator temperature data also showed that the glycol bottle had the slowest time response out of all the temperature buffers we used, as shown by comparing their time constants.
Meanwhile, the probes in the glass beads and the nylon block were virtually identical in thermal response: Our study demonstrated no significant difference between these two temperature buffers in any of the test runs, nothing like the difference we observed between the use of either one of those and the glycol bottle. Therefore we conclude that glass beads should not be used in place of nylon blocks since they showed practically the same performance and nylon is easier to use.
Moreover, the bare probe’s performance showed extreme fluctuation in all our test runs, showing much greater temperature variations than any of the three probe buffers we used. If this had been an actual refrigerator or freezer application, the bare probe would have caused several false alarms and produced widely-varying temperature data. Since reducing temperature variability is so critical to effective monitoring, staff can easily avoid this by simply using temperature buffers on all probes used for medical monitoring purposes.