Description
The VL-BR Strain Gauge Bridge Data Logger is a single channel, battery powered, stand-alone strain gauge bridge data logger. It supports one 4/6 wire Wheatstone bridge by providing voltage excitation, excitation voltage compensation, and low-level signal amplification. Data is stored in nonvolatile flash memory for later retrieval.
The VL-BR Strain Gauge Bridge Data Logger features a measurement input voltage range of -8 mV to +8 mV to accommodate most common bridges with a sensitivity of up to 3 mV/V.
Featuring an aluminum enclosure and PCB coating, the logger has excellent performance in the harshest industrial environment.
Powered by 16-bit ADC and programmable input range, the logger is well suited to science and laboratory applications where precise and accurate measurement is critical.
Siteview software is required and sold separately. One license per site, can be used on multiple loggers.
Software
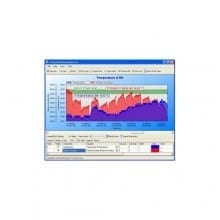
Siteview Software
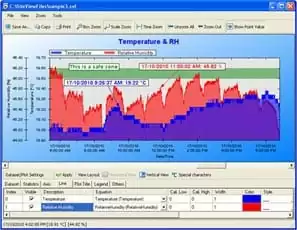
SiteView is a Windows-based application which works with the VersaLog Series data loggers for downloading, configuration, data analyzing and plotting. Its user-friendly graphic interface plus powerful functionality fit both novice and advanced users.
The versatility of custom equation and custom-line equation handle complicated measurement requirements.
- Supports USB, Serial port and Ethernet connections for easy local and remote access
- Fast communication speed up to 115200 bps makes downloading fast
- Real-time view and chart recording replaces chart recording device
- Custom equation and custom-line equation solves scientific and laboratory algorithm difficulties
- Zoom in/zoom out, annotation/label of graph functions provide detailed view of data
- Multiple file loading allows easy data comparison.
- Dynamic statistics provides detailed information of current zoomed view
- One license per site required, can be used on multiple loggers.
Software Requirements:
- Computer with 1.0 GHz or faster processor
- 256K Memory or higher
- 1.0 GB of available hard-drive space or higher
- Windows XP with SP2 or later, Vista, Windows 7 and 8
- At least one USB port or one COM port