
Problem
 One of the most common questions our tech support staff gets is, “Why does the temperature measured by your data logger not match the temperature displayed on the thermometer on my refrigerator?” This is usually followed by, “What is wrong with the logger?” And, while we have run across a few defective devices, in nearly every case we found that the data logger was working as intended and was providing accurate data. The answer is a bit more subtle. There is no “one” temperature in your refrigerator or freezer, but rather a range of temperatures from top to bottom and front to back. The value that you measure depends on where the probe is located.
This paper presents the results of a quick experiment to show the range of temperatures observed in a common refrigerator that you might find in a pharmacy or small lab. It probably represents a worst-case example in that these types of refrigerators are not really designed to provide a uniform temperature throughout the cabinet.
Experimental Setup
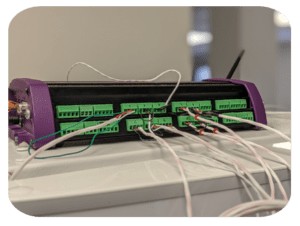
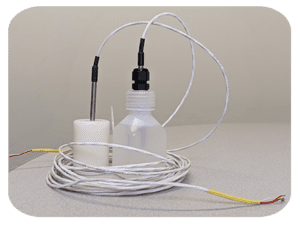
Our goal for this test was to simultaneously measure the temperature at multiple points inside of the refrigerator over several hours to how it varied based on probe location and over time. To perform the measurements, we used a dataTaker DT85 data logger which offers 16 universal analog input channels that accept a wide variety of sensors. To get accurate measurements, we chose 3-wire RTD probes ¼” inch in diameter and 6 inches long. We also chose these because they are commonly used in high-end temperature monitoring systems for life science applications. The data logger was outfitted with 10 probes and programmed to sample the data every 30 seconds, saving the data in its internal memory. At the conclusion of each test, the data was downloaded and Microsoft Excel was used to chart and analyze the results.
Prior to running the test in the refrigerator, a calibration run was done to verify that the temperatures measured by the individual probes were the same. For this test, all of the probes were immersed in a stirred ice water bath and the temperature was monitored over a period of several minutes. Since the goal of this was not to determine the absolute accuracy of the measurement but rather the variation from probe to probe, we decided that a traceable calibration was not needed.
Because the probes were selected randomly, we ended up using RTDs from several different manufacturers, and during the initial testing, we found a total variation in the temperature measured across all 10 probes of about 0.4°C. To reduce the amount of variation, we used the ability to enter individual offsets for each channel into the data logger and repeated the test until we were happy with the data. The figure below shows the results from the final calibration run.
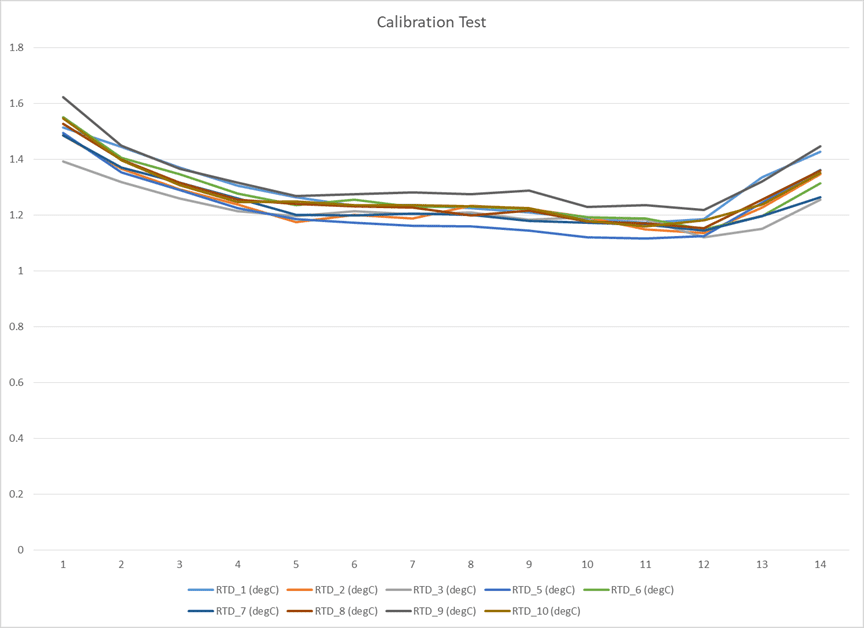
After a few rounds of adjustment, we were able to get the total variation across all 10 probes to be within about ±0.1°C.
Next, we moved the data logger and probes to the refrigerator and started placing the probes at various points within the cabinet. A total of 9 probes were positioned in the refrigerator.
- Door – top, middle, and bottom shelf
- Shelves – close to the center of each shelf, again: top, middle, and bottom
- One in the lowest drawer
- One on the bottom shelf in the back-left corner
- One on the top shelf directly below the evaporator
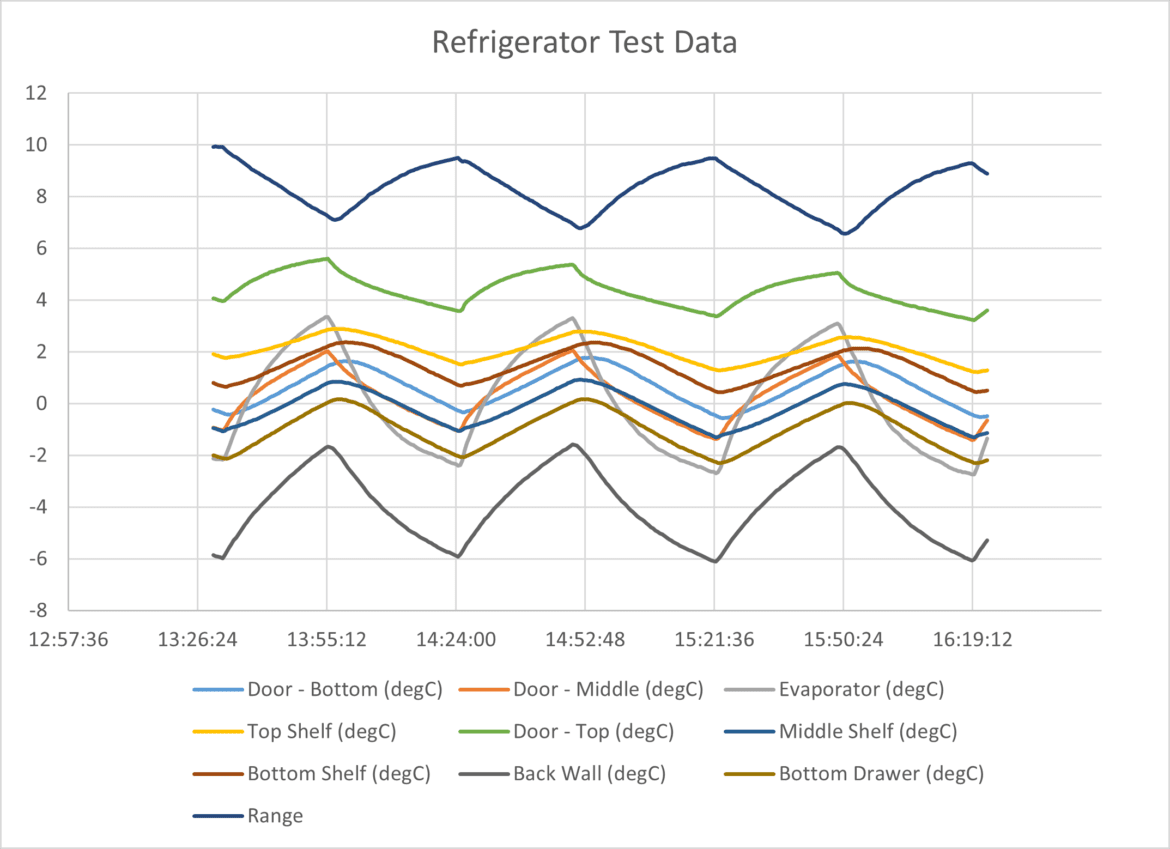
The recording was started while the data was being monitored. The door was opened several times so we waited until there was no activity and the temperature was allowed to stabilize. We then collected data over a long enough time that we could see three cycles of the refrigeration compressor cycling on and off over about three hours. The figure below shows a chart of this data.
Test Results
The temperature data collected in this test contain some very interesting information about what is going on inside of the refrigerator:
- As expected, we observed the normal cyclical fluctuations as the refrigeration compressor turned on and off. The cycles lasted a bit less than one hour.
- Within these cycles, as expected, the variation is worse in the location closest to the evaporator. Here, the difference between the lowest and highest temperature is almost 5°C (-2°C to + 3°C).
- The coldest spot is in the lower back corner of the refrigerator. While the thermostat was set for a nominal temperature of around 1°C, in this location the temperature was consistently below 0°C. It is believed this is because the cold air flowing over the evaporator falls down the back wall of the refrigerator and settles in this location.
- Within the main cabinet of the refrigerator, there is a variation of almost 6°C between the warmest and coldest spots. This variation is pretty consistent even as the compressor cycles on and off. The warmest spot is the top shelf in the door and the coldest spot is in the bottom drawer.
- The total range between the coldest and warmest spots in the refrigerator varies between 7° and 10°C as the refrigeration unit cycles on and off.
Conclusion
 What does all of this mean? The temperature that you read inside of your refrigerator depends strongly on where the temperature probe is located! In many cases, we find that customers are looking at the built-in temperature display located in the door of the refrigerator and comparing it to the temperature recorded by the data logger, which is using a probe that is located on one of the shelves. From the data, we can see that there could easily be a difference of 2°- 3°C or more between these locations.
Second, even if the probes for both monitoring systems are placed within the main cabinet of the refrigerator, it is important to be very careful not to get one of the probes closer to the evaporator or the air stream that is flowing off it. The evaporator and the air coming off it will be substantially cooler (up to 4°C) than the rest of the interior of the refrigerator, especially while the refrigeration compressor is running. A difference in location of even a few inches can make a big difference in the observed temperature.
Finally, the temperature of the refrigerator will vary considerably over time as the compressor cycles on and off. If the temperature that is being compared to the data logger is being measured by a mercury thermometer or an electronic display, the response times of these can make a difference in the observed value. A mercury thermometer in the air can have a response time of 5 minutes or more while the data logger with an RTD probe can react to changes in temperature 10x faster. The observed temperature difference could be that you are simply comparing the average temperature with the instantaneous temperature.
For further information on refrigerator temperature monitoring, or to find the ideal solution for your application-specific needs, contact a CAS Data Logger Application Specialist at (800) 956-4437 or request more information.