
If you are experiencing graphing issues with Accsense Monitoring Systems using Internet Explorer 8 or above, we have a quick fix for you in this brief walkthrough. Whether you’re using our wired pods or wireless temperature data loggers, you can quickly resolve any graphing problems you may have.
Since Microsoft has changed how Internet Explorer 8 and above renders certain flash content in Windows Vista, 7, and 8, this can cause issues in the Accsense Monitoring System web interface when loading historical graphs of users’ data. This issue takes the form of a constant ‘loading’ message instead of displaying the graph normally.
However you can easily resolve this graphing issue by using Internet Explorer’s Compatibility Mode. You can do this in either of two ways:
- For a quick solution, look on the right-hand side of the address bar where you will see an icon that looks like a ripped page of paper:
![]()
Just click on this icon in the graph window to reload the page in Compatibility Mode. This will display the graph normally.
- For a permanent solution, just open Internet Explorer and press your keyboard’s Alt key to open up IE’s drop-down menus. These appear just underneath the address bar and give you options such as File, Edit, View, Tools, etc. Click on the Tools menu. You’ll see the following menu:
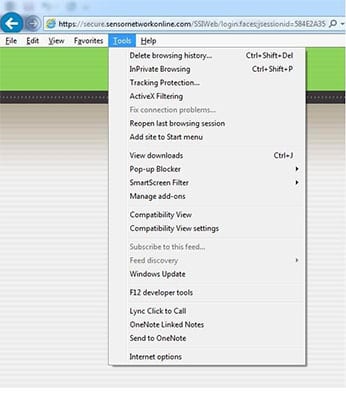
From the list click on Compatibility View settings, and then click the checkbox next to ‘Display all websites in compatibility view’. Now click ‘Close’. This will permanently remove your graphing issues.
To resolve this or other issues you may be having, you can also refer to our Accsense FAQ page.
Accsense provides a range of wireless temperature data loggers and wired pods to help protect your critical healthcare and life science products. Offering higher accuracy than paperless chart recorders or electric thermometers, Accsense is more reliable and sends all your temperature data online where it’s available 24/7. No competing system is this easy to learn, to use, or to access.