
Delphin Loggito Provides Real-Time Process Optimization
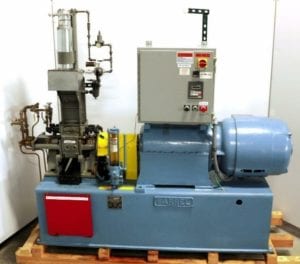 A customer contacted us to find out if we could provide a data acquisition system for a very old piece of equipment used to blend raw materials for rubber compounds, which was used in a development lab. During the rubber mixing process, several parameters needed to be measured and charted to indicate the blending was complete. Because of the age of the machine, there were only panel meters and LED readouts with no way to electronically capture the data or display trend info. This required an operator to constantly monitor the process and, if necessary, manually record data on paper.
Solution
After a visit to the customer site and a run-through of a sample blending operation, it was determined that there were four key parameters that needed to be captured:
- Temperature at 2 locations in the blending chamber
- Current draw of the mixer motor
- Blending speed in Rotations Per Minute (RPMs)
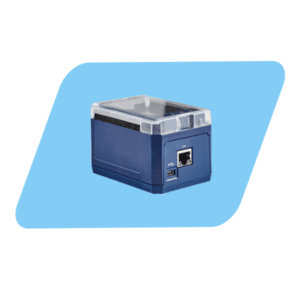
We determined that a Delphin Loggito data logger would be a perfect fit for this rubber mixing process project. It offered 4 universal analog inputs that could handle all of the measurements needed. With a sample rate of 600 Hz, it could easily collect data fast enough to generate a real-time chart with the time resolution necessary to monitor the blending process.
To display the data, Delphin Profisignal Go software was chosen. It provided the ability to quickly build a strip chart to display the four parameters as a function of time with multiple y-axes for the different parameter types. A recorder function allowed the customer to capture the data for each test run in a separate .CSV file that could then be easily imported into Excel for further analysis.
Installation
 The installation of the hardware was straight forward, but because of the age of the system, the electrical hookup provided several challenges. The Loggito data logger was installed in the existing control cabinet using the DIN rail mounting clips that are supplied with the unit. A separate plug in DC power supply was used to power the logger since the power provided by the existing 24 VDC supply in the control cabinet was very “dirty”. To avoid potential grounding issues, a heavy wire was run from the PE terminal of the Loggito to an existing ground stud in the control cabinet.
Thermocouples – The blending system already had 2 J-type thermocouples mounted in wells in the blending head. After a bit of testing, it was determined that the Loggito could be used to measure these by connecting in parallel with the existing temperature display without causing any accuracy issues. Short runs of J-type extension wire were used to run from the termination point on the existing display back to the logger.
Mixer Motor – The blender was driven by a large, very old DC drive. The drive had an existing analog current readout that used a mV current shunt in one of the power leads. During testing, it was discovered that the shunt was in the high side of the drive power supply and that the common mode voltage could be > 100 VDC, which exceeded the limits of the analog inputs of the Loggito. To provide isolation, a Dataforth 8B30 mV input signal conditioner module was used to measure the voltage across the shunt by connecting in parallel with the existing analog meter. This module provides up to 1500 Vrms of common mode isolation with the additional benefits of 60 Hz noise filtering and amplification of the mV input to a 0-5VDC output.
Blending Speed – The unit had an existing LED panel meter to display RPMs. The display used some sort of magnetic pickup on the drive shaft. However, this pickup generated a sinusoidal variable voltage and variable frequency signal. This signal was not directly compatible with the frequency counter inputs of the Loggito because at low RPM’s the amplitude of the signal was too low to be accurately registered. A Dataforth 8B45 frequency to voltage converter signal conditioner was also used.
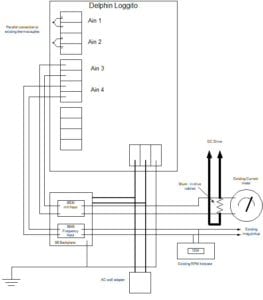
Figure 1. Wiring of the Delphin Loggito
Usage
Once the hardware was in place, the analog channels of the Loggito were set-up using the DataService Configuration software. This allowed each channel to be independently configured for the signal type: thermocouple (or voltage in this case) and where necessary, scaled to the proper values and units.
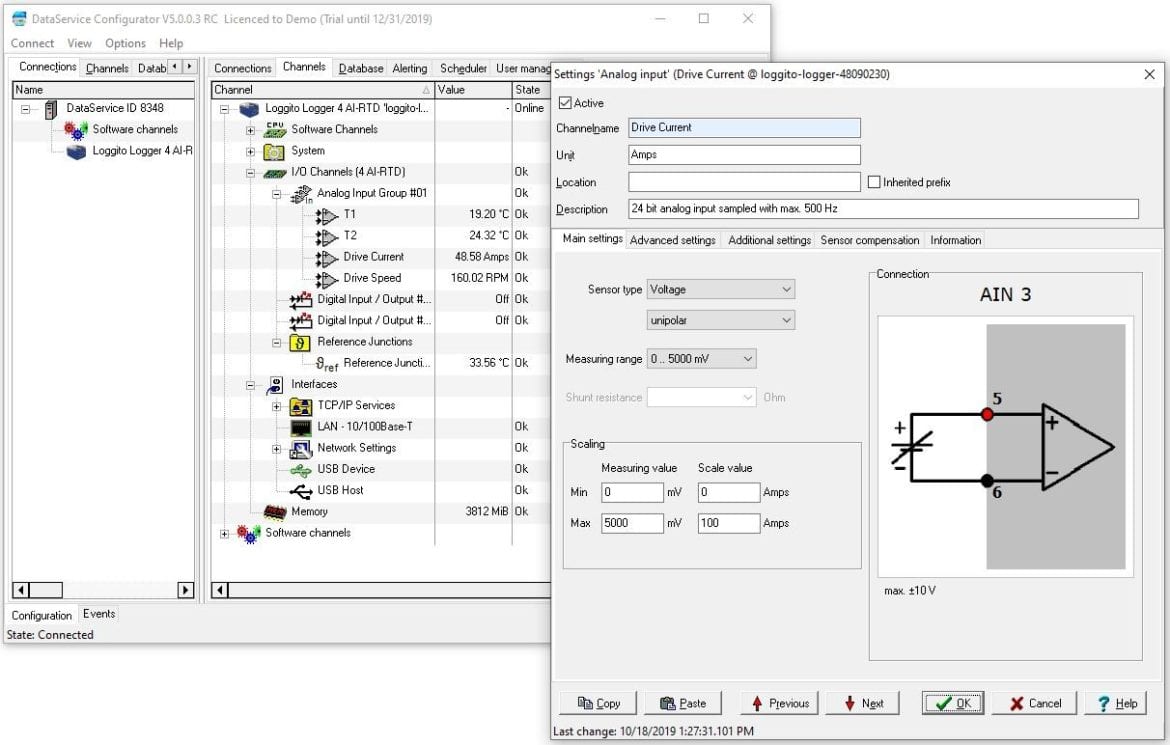
Figure 2. DataService Configurator
Finally, a project was created in Profisignal Go Software with a Y vs. time chart showing all four parameters with three separate y-axes: one for temperature, one for motor current, and one for motor speed. A recorder object was added to allow the operator to start and stop data capture to individual files for each test run.
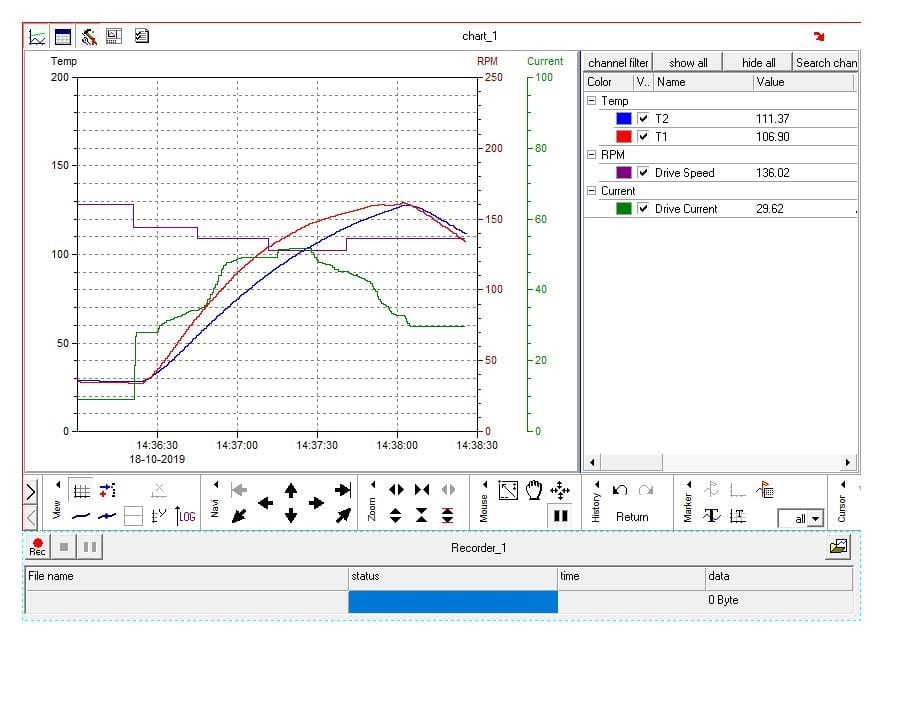
Figure 3. ProfiSignal Go Chart
Benefits
The most immediate benefit was that the operator could instantly determine when the rubber mixing process was complete by looking at the shape of the curves displayed in the graph. Secondly, all of the data was accurately recorded to provide a full picture of what was happening during the blending process. This data could be easily exported and used for comparison, analysis, and optimization of the process. Lastly, since the Loggito was connected to the factory’s network, long processing runs could be remotely monitored without the need for the operator to stand by the machine watching analog meters and LED readouts.
For more information on Delphin Loggito Data Loggers, or to find the ideal solution for your application-specific needs, contact a CAS Data Logger Applications Specialist at (800) 956-4437 or request more information.